Zambretti Weather Forecast Integration
- Before we get going
- Overview
- How It Works
- Install
- Using the integration
- How useful is Zambretti?
- How Forecasts Are Generated
- Integration Attributes & Meanings
- A deep dive
Before we get going
This integration does not run on the Home Assistant weather platform, so no pretty graphs, colours and icons! It provides several text forecasts and numerical data that, taken together, help you in making decisions that depend on weather.
Currently this Zambretti integration only applies to the North Atlantic, a square from the Caribbean to the eastern Mediterrenean to the Baltics to the Eastern Seaboard / east Canada. If you live outsine that area this integration is not (yet, who knows) 100% functional for you.
If you are on a boat you will want NMEA0183 and/or NMEA2000 sensors read into your Home Assistant. An absolute must-see for you is Smart Boat Innovations. I have worked closely with them on a few really useful Home Assistant integrations and higly recommend them.
Overview
The Zambretti Weather Forecast Integration provides a weather forecasting system for Home Assistant, using historical sensor data to determine weather trends. It is particularly useful for sailors and outdoor enthusiasts, as it offers insights into wind conditions, pressure trends, and fog likelihood.
For that, it only uses local sensors and does not require the internet. As such, it is completely different from traditional forecasting that is based on complex weather systems hundreds of kilometeres away, on patterns kilometers above sea level and on a supercomputer whose power draw will make you turn white. This is not that.
This Zambretti Weather Forecaster knows about the wind systems in and around the north Atlantic. It's fun and maybe useful to see you might be in the Mistral!
How It Works
Zambretti integration collects sensor data from Home Assistant, including:
- Atmospheric Pressure – Determines weather trends.
- Wind Direction & Speed – Assesses wind conditions.
- Temperature & Humidity – Calculates fog likelihood and temperature effects.
- Location Data – Determines regional wind patterns.
It uses the recorded history of sensors. So make sure the required sensors are recorded at for least 3 hours. More if you configure Zambretti to use longer periods for pressure analysis. See Recorder: in config.yaml ... if it is not there every sensor is recorded. Normally all sensors in Home Assistant are recorded for at least 7 days.
You decide the update frequency of the Zambretti weather forecast in de integration configuration. Apart from debugging it is utterly useless to update every minute (unnecessarly burdens Home Assistant) but anything from 15 to 60 minutes is appropriate.
Install
Install via HACS (not yet possible!)
- Add my repository to HACS
- Add this custom integration via HACS (Home Assistant Community Store).
- Restart Home Assistant.
Install Manually
- Copy the Zambretti directory to your config/custom_components directory
- Restart Home Assistant.
Configure Sensors
You will need a proper true wind direction sensor. If you are on a boat or an RV you might not have it. Read the next chapter on what to do. Same goes for sensors that don't provide in Knots, °C or hPa.
- Go to Settings → Devices & Services
- Click + ADD INTEGRATION and add Zambretti Forecast.
- Provide sensors for:
- Wind Direction (degrees 360° [not 400])
- Wind Speed (knots)
- Atmospheric Pressure in hPa
- Temperature (°C)
- Humidity (%)
- Latitude & Longitude of your location
- You can fine tune Zambretti with the following parameters:
- Update interval (minutes). Don't make it too short as it will unnecessarily burden your Home Assistant without adding value.
- Pressure history (in hours) to use for pressure analysis (1 to 12h)
- Fog area type. Different areas have different likelihood of fog. Adjust here to adjust the chance of fog.
The Zambretti integration uses the sensors above and the settings to make a forecast. You can change these at any time. Click (CONFIGURE) for the Options dialog and make your changes. Then reload the integration (three-dot menu). This is a good way to experiment with the pressure history settings and immediately see the results.
Create your own wind direction sensor
You will need a sensor for true wind direction. If you use this while mobile (on a boat or a camper van) you will likely only have apparent wind direction. That means you will have to create a helper that uses the apparent wind direction and the compass heading. That helper would be a template sensor. The formula is pretty simple:
True wind direction = Wind angle - (360 - compass heading)
You need the helper to configure the Zambretti integration, so create the helper first. Go to Settings → Devices & Services → Helpers, click + create helper**, choose {} Template, choose Template a sensor. Now enter a name - let us call it True wind direction - and enter the template below. You don't need lines beginning with a hash as they will be removed by Home Assistant anyway.
# Get sensor.heading_degrees from your compass and determine how much to rotate to get north
{% set rotate = 360 - states('**sensor.heading_degrees**') | float(0) | int %}

# Get the wind direction from your wind sensor
{%  set apparent = states('**sensor.wind_angle_degrees**') | float(0) %}
{{ (apparent - rotate) | round(0) }}
(the '| float(0)' is to stop the helper from generating an ugly error if your sensor is not (yet) available). Change the sensors in between asterisks to your own sensors and remove the asterisks.
A problem might be that NMEA2000 sensors use wind angle for other stuff too. In order to filter that out we need to look at the reference entity of your apparent wind angle sensor. It would look something like this:
# Get the wind direction from your wind sensor
{% set apparent = states('**sensor.wind_angle_degrees**') | float(0) %}
{% if states('sensor.**sensor.wind_angle_degrees_reference**')|float(0)>1 %}
{{ (apparent - rotate) | round(0) }}
{% else %}
{{ states('sensor.true_wind_direction') }} #yes, the value of the sensor we are calculating. Works.
{% endif %}
It is best to try this out in Developer tools → template.
Are your units of measurement different?
If your instruments provide other units (pressure in inches of mercury inHg, temperature ° Fahrenheit, wind in meters per second m/s) etc. you can create template helpers to convert to the units of measurement Zambretti requires. Then use these helpers in the integration configuration of Zambretti. As an example, to convert inHg to hPa create a helper with template:
# Change sensor.pressure to your atmospheric pressure sensor
{% set inhg = states('sensor.pressure') | float(0) %}
{{ (inhg * 33.8639) }}
Zambretti will only report in hPa, knots and ° Celsius.
Tip Use ChatGPT to provide you with the template, ask it:
Create a HA helper template to convert inHg to hPa. The input sensor is 'sensor.pressure'.
What sensors?
I use a RUUVI sensor for outside temperature, humidity and atmospheric pressure. Any sensor will do, really, but the RUUVI is weather proof. For wind direction, wind speed and compass heading I use the appropriate integrations (NMEA2000) from Smart Boat Innovations to read these values into Home Assistant.
Using the integration
Wait for Zambretti to have started up
The Zambretti integration needs all its sensors to be on-line before it does anything. On some sensors that may take a while. That means using Zambretti sensor data may cause errors while starting up Home Assistant — all attributes are 'Unknown'. To that end Zambretti has the attribute fully_started. Only if that is true can you rely on the sensor data. As an example below, the first line for the Markdown card caters for that. It also means that you would be wise to use that attribute in an automation in the And if (optional) section to stop the automation from running if Zambretti is not ready yet.
Multiple Forecast Entities
You can have multiple forecasts (Integration entries), using different configurations. Just click ADD ENTRY in the Zambretti Weather Forecast entity overview. It is wise to immediately change the name of the new forecast (3-dot menu) and of the entity (both Name and Entity_id).
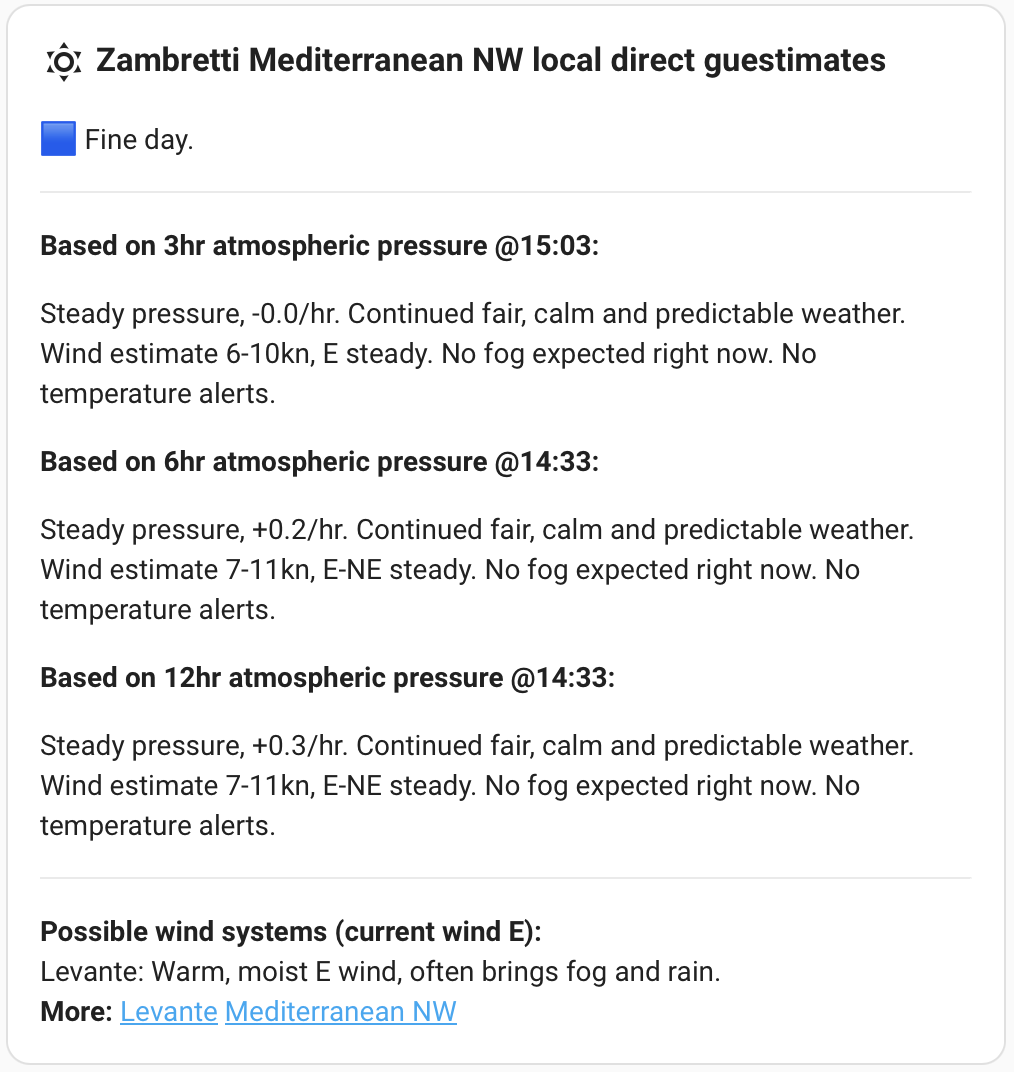
This can be useful, for instance, for having forecasts based on 3hr, 6hr, and 12hr pressure history. To see what works best for you or to get a better picture. It might be wise to set update_interval_minutes to 60 minutes for the 6hr and 12hr forecasts to go easy on Home Assistant.
Example for your dashboard
There is a lot available, but I like to present it in a Markdown card. That way, I have the Zambretti forecast with the wind system, fog chance, and temperature warning all in one card.
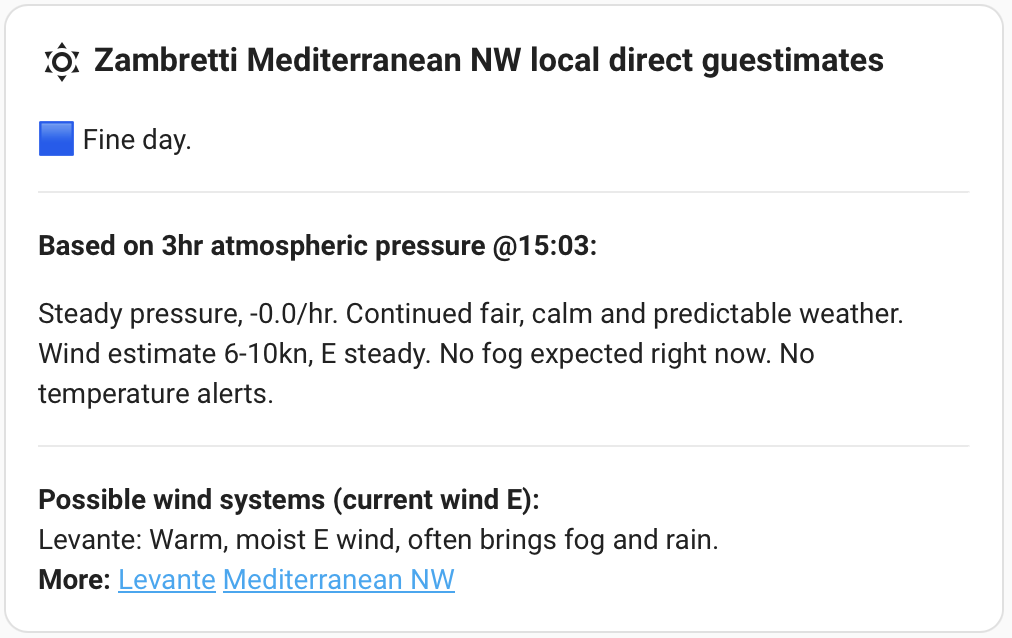
The content for the Markdown card:
{% if state_attr('sensor.zambretti_forecast','fully_started') %}
{{state_attr('sensor.zambretti_forecast','alert') }}
***
Based on {{state_attr('sensor.zambretti_forecast','cfg_pressure_history_hours') }}hr atmospheric pressure:
{{ states('sensor.zambretti_forecast') }}
***
Possible wind systems (current wind {{ state_attr('sensor.zambretti_forecast','wind_direction')}}):
{{state_attr('sensor.zambretti_forecast','wind_system') }}
More: {{ state_attr('sensor.zambretti_forecast','wind_system_urls') }}
{% if state_attr('sensor.zambretti_forecast','temp_effect') != "No temperature alerts." %}{{state_attr('sensor.zambretti_forecast','temp_effect') }} {% endif %}
{% else %}
{{states('sensor.zambretti_forecast') }}
{% endif %}
Add a Markdown card, copy and paste the above, and Bob's your uncle.
If you use multiple forecast entities, you could add a second forecast by adding (use your own forecast name):
Based on {{state_attr('sensor.zambretti_forecast_6hr','cfg_pressure_history_hours') }}hr atmospheric pressure:

{{ states('sensor.zambretti_forecast_6hr') }}
Add a nice pressure graph
I like to have an Atmospheric Pressure graph near (directly under) the Zambretti Forecast. The Statistics Graph Card automatically adjusts the scale. As a consequence, a minimal change in pressure may be displayed as a nightmare in the making. That is just confusing; I don't like it.
To prevent this, change the following in the card:
Y-axis minimum= 1003y-axis maximum= 1023 (1013 is the world average pressure)Extend Y axis limits to fit datatoon.
That way, it won't cause a panic when there is nothing much going on while still changing the scale automatically if required.
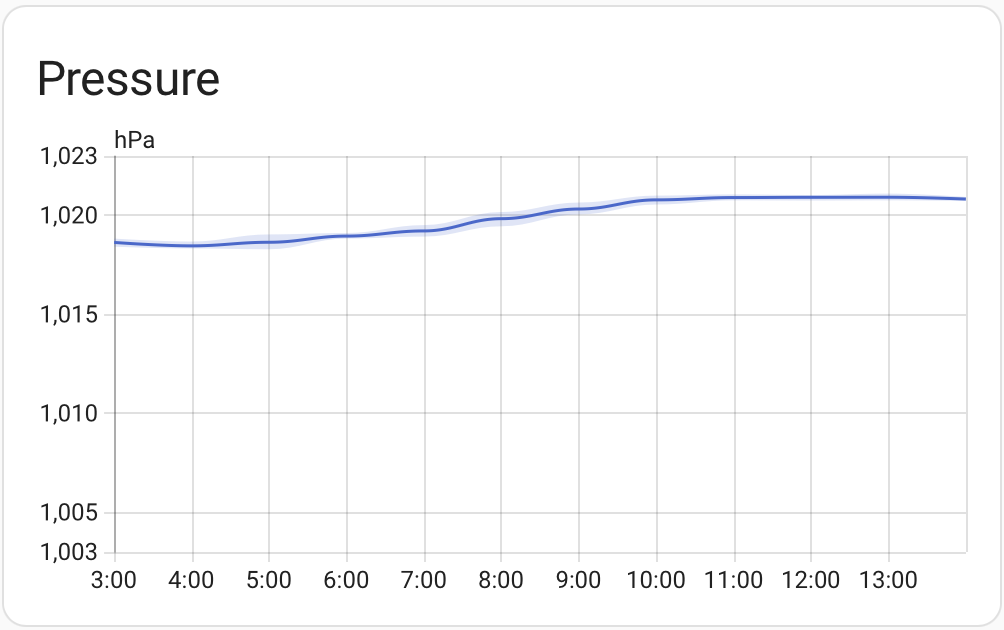
If you want, you can change the Days to show using decimals: 0.125 days is ... yup ... 3 hours.
Automations and Voice
Of course, if alert_level changes to 4 or 5, I have my Voice-PE warning me of impending doom. You'll need an automation.
Most of the data is not in the entity state but in its attributes. To use them for a trigger ('When') in an automation:
- Choose
TemplateinAdd triggerdialog - In
Value template, enter (keep the double quotes):
"{{ state_attr('sensor.zambretti_forecast','wind_direction') == 'NW' }}"
If you are numerically testing a value, then this is an example:
"{{ state_attr('sensor.zambretti_forecast','estimated_wind_speed')|float(0) > 1015 }}"
A handy alternative is to create a sensor from an attribute. Here we go:
Create your own sensor from an attribute
I hate it if an integration creates many sensors. I already have thousands. So Zambretti is one sensor with a list of attributes. You may want some of them to be sensors because sensors are easier to handle. You can turn attributes into proper sensors.
- Go to
Settings→Devices & Services→Helpers - Click
+ CREATE HELPER - Choose
{} Template, chooseTemplate a sensor - Enter a name (let's call this one
Zambretti Region) - Enter the template below (this is region, change for your attribute)
{{ state_attr('sensor.zambretti_forecast','region') }}
- Add other information as required (maybe Unit of Measurement
knfor wind speed) - Submit.
Done, you now have a new sensor. Home Assistant will build a history for it, and you can use it anywhere.
See Integration Attributes & Meanings below for a full list of attributes.
How useful is Zambretti?
A reasonable forecast window for Zambretti barometer-based weather prediction is up to 12 to 24 hours. Note: there are two types of window:
- The past, for analysis and to create the forecast
- The future, the forecast
This paragraph is about the latter.
Why up to 12-24 Hours?
- Zambretti’s method is based on atmospheric pressure trends, which change over short periods. Unlike modern numerical weather models that use satellite data and physics-based simulations, Zambretti is a statistical model designed for short-term forecasting.
- Beyond 12 hours, pressure changes become less reliable indicators of weather, as other factors (e.g., temperature changes, frontal systems, and regional variations) start influencing the weather more significantly.
- Most historical applications of Zambretti were designed for same-day or next-day forecasting. It was commonly used by sailors, farmers, and amateur meteorologists for short-term weather guidance.
Recommended Forecast Window Options
- Short-term (1-12 hours): More reliable but limited.
- Standard (12-36 hours): Somewhat useful but increasingly uncertain.
Zambretti Struggles with Fast-Moving Systems
Zambretti’s forecasting method is based on gradual pressure trends, making it less reliable in situations where weather systems change rapidly. Why?
- Designed for Slow Changes:
- Zambretti assumes weather changes occur over several hours, making it better for stable, gradual pressure shifts.
- Doesn’t Account for Frontal Systems:
- Fast-moving cold fronts or low-pressure systems can cause sudden, sharp weather changes that Zambretti cannot anticipate accurately.
- Rapid Pressure Drops Cause Errors:
- In stormy conditions, pressure can fall 5-10 hPa per hour, leading to incorrect or overly dramatic predictions.
- Local Effects (e.g., mountains, coastlines):
- In areas where wind-driven systems dominate (like hurricanes, squall lines, or strong depressions), Zambretti may lag behind real conditions.
This Zambretti integration also analyzes wind and temperature changes that may add value to the forecast. It also has a fog analysis as a stand alone warning — fog is not used for the forecast.
So what is the value?
In the end, this Zambretti integration provides you with a set of forecasts (general forecast, alert, wind, temperature, fog, wind system) that all together can help you make decisions (e.g. "Go out sailing" versus "Buckle up" versus "Stay put"). As with any weather forecast, don't blame Zambretti if it doesn't pan out the way it was forecast.
How Forecasts Are Generated
1. Wind System
- Uses latitude, longitude, and wind direction to determine prevailing wind patterns.
- Applies regional wind modifiers (e.g. Mediterranean or Caribbean) based on historical weather data.
2. State (Weather Forecast)
- Uses the pressure trend over the last three hours.
- Based on the Zambretti Forecaster Algorithm, which evaluates pressure trends:
- Rising Pressure → Stable and fair weather.
- Steady Pressure → Normal conditions, with some cloud variations.
- Falling Pressure → Increasingly unstable weather.
- Falling fast Pressure → Weather warnings, wind coming.
- Plummeting Pressure → Storm warnings, severe weather risk.
- These trends are then combined with current atmospheric pressure to determine storm risk and possible wind.
- Icons are assigned to match Home Assistant’s weather indicators.
3. Wind speed forecast
- Uses the current wind and the weather forecast to calculate an expected wind speed range. Not to be read as "wind & gusts" but "wind might pan out to be in this range" ... gusts might be (way) higher.
4. Temperature Effect
- Compares temperature changes over the past 2 hours.
- If the temperature rises or drops sharply, a warning is generated for possible bad weather.
- If the temperature drops sharply in the evening or rises quickly in the morning, adjustments are made to account for natural sunrise/sunset effects.
5. Fog Chance
- Calculates fog probability based on:
- Humidity – Higher humidity increases fog risk.
- Temperature & Dewpoint – The closer they are, the higher the fog likelihood.
- Wind Speed – Stronger winds reduce fog formation.
- Fog area type - different areas have a different likelihood of fog, due to their specific nature.
- Provides an estimated percentage chance of fog.
6. Alert
- Determines storm risk based on pressure trends, temperature shifts, and wind speed. Alert levels range from 0 (fine weather) to 5 (severe storm warning):
| alert_level | Alert |
|---|---|
| 0 | 🟦 Fine day. |
| 1 | 🟩 No worries. |
| 2 | 🟩 Mild day. |
| 2.1 | 🟩 Mild day. Wind picking up a bit, possibly up to 25kn. |
| 2.2 | 🟩 Mild day. Wind picking up, possibly up to 30kn. |
| 3 | 🟨 Caution. Unstable conditions, moderate winds, squalls possible. |
| 3.1 | 🟨 Caution. Wind picking up, possibly up to 40kn, squalls possible. |
| 4 | 🟧 Alert! Strong winds, rough seas, storm risk increasing. |
| 4.1 | 🟧 Alert! Rough seas, storm risk, strong winds possibly up to 50kn. |
| 5 | 🟥 Alarm! Heavy storm, gale-force winds, dangerous sailing conditions. |
| 5.1 | 🟥 Alarm! Heavy storm, gale-force winds possibly more than 50kn. |
Integration Attributes & Meanings
Attributes are great. That's why there are so many.
| Attribute | Description | Possible Values |
|---|---|---|
| icon | Icon used for this entity | e.g. mdi:zend |
| alert_level | Weather risk alert level | 0 (fine) to 5 (severe storm). If it has a decimal (e.g. "4.1") it has a wind warning too. |
| alert | Text/description of the alert level | Icon (different one from above) and text |
| region | Geographic region derived from latitude & longitude | e.g., "Atlantic Coast", "Mediterranean Northwest" |
| region_url | URL for more information on weather in that region | Typically WikiPedia links |
| wind_system | Regional wind patterns based on location and wind direction | e.g., "Mistral", "Bermuda High" |
| wind_system_urls | HTML tags linking to a webpage for the wind system | Typically WikiPedia |
| fog_chance | Forecasted probability of fog (in text form) | e.g., "Fog is unlikely." |
| fog_chance_pct | Numerical fog probability | 0–100 (%) |
| dewpoint | Calculated dewpoint temperature | Degrees Celsius (°C) |
| humidity | Current humidity reading | Percentage (%) |
| temp_diff_fog | Temperature difference to dew point | e.g., "2°C" |
| temp_effect | Effect of temperature change on weather | e.g., "Significant cooling trend; expect unstable weather with increased wind speeds." |
| temperature_diff_hour | Temperature change over the last hour | e.g., "-4°C" |
| wind_speed | Current wind speed (analysis result) as an average to weed out normal variations | Knots (kt) |
| wind_direction | Most frequent wind direction, based on history, to weed out normal variations | e.g., "NW" |
| estimated_wind_speed | Forecasted wind speed | e.g. "14-21" |
| estimated_max_wind_speed | Estimated maximum wind speed | e.g. "21" |
| wind_forecast | Wind forecast in text | e.g., "Estimated wind 14 - 21kn," |
| wind_direction_change | Likely wind direction change based on pressure trend | e.g., "veering", "backing fast" |
| pressure_trend | Pressure trend (rising/falling/steady) | e.g., "plummeting", "rising", "steady" |
| pressure_move_per_hour | Pressure change per hour | e.g., -3 (hPa/hour) |
| method_used | Method used for determining trend | Straight-line or U-curve |
| method_deviation | Deviation from the straight-line model | e.g., "0.19" |
| hist_wind_speed | Number of wind speed entries used in analysis | Integer |
| hist_wind_direction | Number of wind direction entries used in analysis | Integer |
| hist_pressure | Number of pressure entries used in analysis | Integer |
| hist_temperature | Number of temperature entries used in analysis | Integer |
| sensor_latitude | Direct sensor reading for latitude | e.g., "52.379189" |
| sensor_longitude | Direct sensor reading for longitude | e.g., "4.899431" |
| sensor_wind_direction | Direct sensor reading of wind direction (raw) | Degrees (°) |
| sensor_wind_speed | Direct sensor reading of wind speed (raw) | Knots (kt) |
| sensor_humidity | Direct humidity sensor reading (raw) | Percentage (%) |
| sensor_temperature | Direct temperature sensor reading (raw) | Degrees Celsius (°C) |
| sensor_pressure | Direct pressure sensor reading (raw) | hPa |
| cfg_update_interval_minutes | Configured update interval in minutes | e.g., 1–60 |
| cfg_pressure_history_hours | Hours in the past for pressure analysis (config) | Default = 3 |
| cfg_fog_area_type | User-defined classification for fog likelihood | e.g., frequent_dense_fog, normal |
| last_updated | Timestamp of last data update | Local time in HH:MM format |
| prev_update | Timestamp of previous update | Local time in HH:MM format |
| fully_started | Indicates whether Zambretti has fully started its analysis | True or False |
There may be debugging attributes ('dbg_xxx'). Do not use them as they may disappear in future updates.
To display attributes, go to Settings → Devices and services → Entities, open the entity Zambretti Forecast, then click on Attributes to drop them down. Use attributes in templating like this:
{{ state_attr('sensor.zambretti_forecast','estimated_wind_speed')|float(0) }}
Note: '|float()' — only for numerical values — not only converts to a true number, it also catches 'Unknown' and 'Unavailable' without causing errors.
A deep dive
We live on a sailing yacht in the mediterranean. Wind and weather are important for our comfort and safety. Weather forecasts get it wrong regularly because we miss our predicted system or hit a neighbouring system due to inaccuracies. On top of that we use Starlink and recent events (early 2025) have made us doubt continued availability. We have a lot of instruments on our yacht and using the excellent integrations made by Smart Boat Innovations they are all available in Home Assistant. So why not use these to add to my toolbox of forecasting? The nice thing is that this is local and doesn't require an internet connection. On top of that, if the weather forecast is way off, my local sensors are right!
The Zambretti forecasting model was developed by Negretti & Zambra, a British scientific instrument company, in 1915. It was designed as a mechanical weather forecaster that predicted weather conditions based on barometric pressure trends, wind direction, and seasonal variations.
Even though modern weather forecasting is based on numerical weather prediction models like GFS and ECMWF, the Zambretti model is still useful for:
- Local, real-time forecasts using only barometric pressure
- Sailing, hiking, or outdoor activities where internet access is unavailable
- Home weather stations that rely on simple sensor data
This Zambretti integration, however, is a heavily modified forecasting model. It improves upon the 1915 model by:
- Using sensor history instead of manual readings
- Incorporating temperature, humidity, wind speed, and location
- Forecasting fog
- Forecasting wind
- Monitoring fast temperature changes
- Providing alerts and trend analysis automatically
If you have the right sensors, then Home Assistant provides temperature, wind speed, wind direction, relative humidity, accurate location, and a history of sensors. Therefore, the forecast can be way more accurate and broader than the basic Zambretti. So me and my girlfriend (ChatGPT — you got it, I am a nerd) got to studying weather and programming.
Even still ... this is nothing more than a simple forecast integration, however intelligent it is. A forecast may be way off, especially if there are fast-moving weather systems in the neighbourhood.
What and how does the Zambretti integration analyse?
Region
Zambretti knows about regions (e.g. 'Mediterranean Southeast', 'Caribbean') and determines which region applies using the latitude and longitude you provide through sensors.
Wind analysis
Wind speed and wind direction fluctuate a lot. So a reading of the current state is useless. Zambretti uses the history to calculate the average over the past 10 minutes and uses that. Using the Home Assistant recorder, Zambretti determines:
- The wind direction, as an average over the last 10 minutes, in 16 sections (e.g. N, S-SE)
- The average wind speed over the last 10 minutes
Pressure analysis
Pressure analysis uses Home Assistant recorder to determine if the atmospheric pressure is rising or falling over the last 3 hours (you can change that in the Configuration dialog to 6, 9, or 12 hours), and how fast. Resulting values can be rising_fast, rising, steady, falling, falling_fast or plummeting.
Measuring the pressure trend is harder than it seems. Looking at the pressure graph, it is hardly ever a straight line over 3, 6, 9, or 12 hours. It is often, but not always, U-shaped or inverse U-shaped.
- So first Zambretti draws a straight line regression. That works great if pressure is rising or falling steadily. If the deviation from this line is not too great, it will use this to determine the trend.
- However, if the deviation from that straight line is too much, it switches to another method. That analyses the trend from the lowest and highest pressure to the current pressure. The largest value wins and is used to calculate the pressure trend in hPa movement per hour. Thus on U-shaped pressure graphs, it tries to use only the most recent "leg" of the "U" as that is most informative for forecasting.
Example Scenarios & Expected Results
| Scenario | Example Readings | Method Used | Trend Output |
|---|---|---|---|
| Gradual pressure drop | 1015 → 1013 → 1009 | Straight-line | "falling" |
| Gradual pressure rise | 1008 → 1011 → 1016 | Straight-line | "rising" |
| Sudden dip (U-shape) | 1015 → 1005 → 1014 | U-curve | "rising" |
| Sudden peak (inverse U-shape) | 1005 → 1015 → 1006 | U-curve | "falling" |
| Minimal change | 1013 → 1013 → 1013 | Either | "steady" |
Temperature analysis
A sharp drop in temperature may indicate bad weather. Temperature analysis looks at the speed of change over the past 2 hours (once again using Home Assistant Recorder) and generates an appropriate message. It also accounts for sunrise (fast increase is normal) and sunset (fast decrease is normal).
Zambretti forecast (weather processing)
The Zambretti forecast is generated using the pressure analysis, average wind speed, and current temperature to create a forecast and an alert level. It does this by:
- Looking at pressure and pressure trend by first determining the trend and, within the trend, looking at the pressure.
- Correcting for low and high temperatures to modify the alert level. High temperatures mean a higher alert level and vice versa.
- Using the current average wind speed and pressure analysis to forecast the wind speed as a "from - to" (using a 20% low and high margin) to cover for uncertainty.
Fog analysis
Analyzing temperature, humidity, and average wind speed, Zambretti determines the likelihood of fog. It does that by using the Magnus-Tetens approximation to calculate the dew point and comparing that dew point to the current temperature. It accounts for wind blowing away the fog, and for high and low temperatures making fog likelier or unlikelier. It then adapts for fog likelihood in your area by using fog_area_type in the integration configuration.
Wind systems
Zambretti tries to help you further by determining what named wind system you might be in now. The description of the wind system may add to the value of the forecast ("aahh ... we're in the Mistral now. Let's tie everything down to prepare."). To that end, there are four tables Zambretti uses:
- Regions, defines the square coordinates of a region. Example:
"british_isles": (49, 61, -12, 2, "https://en.wikipedia.org/wiki/List_of_local_winds#Europe"),  # UK Met Office (Placed before North Atlantic)
"western_europe_coast": (35, 50, -10, 5, "https://en.wikipedia.org/wiki/List_of_local_winds#Europe"),  # Meteo France
"north_sea_baltic": (50, 65, -5, 30, "https://en.wikipedia.org/wiki/List_of_local_winds#Europe"),  # Danish Meteorological Institute (DMI)
"mediterranean_northwest": (38, 48, -10, 15, "https://en.wikipedia.org/wiki/List_of_local_winds#Europe"),  # Spain, France, Ligurian Coast
- Wind Index, with, per region, the main 16 wind directions (N, S-SE, etc.) and the named wind systems (e.g. "Meltemi") for each of these directions. Using the region and wind direction, Zambretti determines the possible wind systems (it is often more than one) that might apply. Example:
"mediterranean": {
    "N": ["Meltemi", "Bora"],
    "N-NW": ["Tramontane"],
- Wind Catalogue, with, per named wind (e.g. "Meltemi"), the latitudes and longitudes where they are possible, the description, and the URL for more info. Example:
"Tramontane": ((40, 48, -10, 6), "Dry, strong N wind over Southern France and Spain.", "https://en.wikipedia.org/wiki/Tramontane"),
"Mistral": ((38, 44, -6, 10), "Cold, dry NW wind, clearing skies in the Western Med.", "https://en.wikipedia.org/wiki/Mistral_(wind)"),
"Libeccio": ((30, 45, -18, 10), "SW wind, stormy in autumn and winter, high waves.", "https://en.wikipedia.org/wiki/Libeccio"),
- Regional catalogue with, per region and wind direction, a description. The regional catalogue is used if there is no named wind system from the Wind Catalogue that applies. Example:
"mediterranean": {
    "N": "Northern winds: Can bring cooler air from Europe, often gusty.",
    "N-NW": "North-Northwest winds: Typically strong, often cold, especially in winter.",
Using the above, Zambretti determines:
- The region, using the lat/lon and the Regions table
- The possible wind systems that might apply in the region, using region + current wind direction + Wind Index
- The applicable wind systems based on where wind systems occur, using the Wind Catalogue table
If no wind system applies, it defaults to the Regional Catalogue.
In other words, in Sicily, a North wind:
- The region is determined to be Mediterranean Southwest,
- With a North wind, the possible wind systems are determined to be "Tramonte" and "Mistral",
- Using the current location, the applicable wind system is determined to be "Mistral" (the location is out of bounds for "Tramonte").
If no wind system is applicable, the default is used for wind N and region Mediterranean Southwest.
Can you add to the wind system catalogues?
Yeah! Sure! The more the merrier. Just let me know through GitHub so I can make everyone else enjoy the fruits of your labour. Use the above format to do this so I can copy-paste for an update. You can use ChatGPT (or another AI) to help you, provided you manage to ask it the right questions. Example:
Can you add the Indian Ocean to the table below: "british_isles": (49, 61, -12, 2, "https://en.wikipedia.org/wiki/List_of_local_winds#Europe"),
Check the result, ChatGPT regularly makes the silliest of errors.
-/-